The front-month natural gas contract jumped by 50% on January 27, the largest single day price increase on record. With the remainder of winter forecasts skewing toward colder weather, these large price swings could become more common. To better understand the drivers for these events, BloombergNEF examined the largest single day price moves since 1990.
Drivers are bucketed into three categories: weather forecasts, technicals and fundamentals. Technical drivers are related to the financial trading and risk management of gas contracts, which includes short-squeeze events. A single-day price swing is defined as the difference in price for the contract between open and close on the same day.
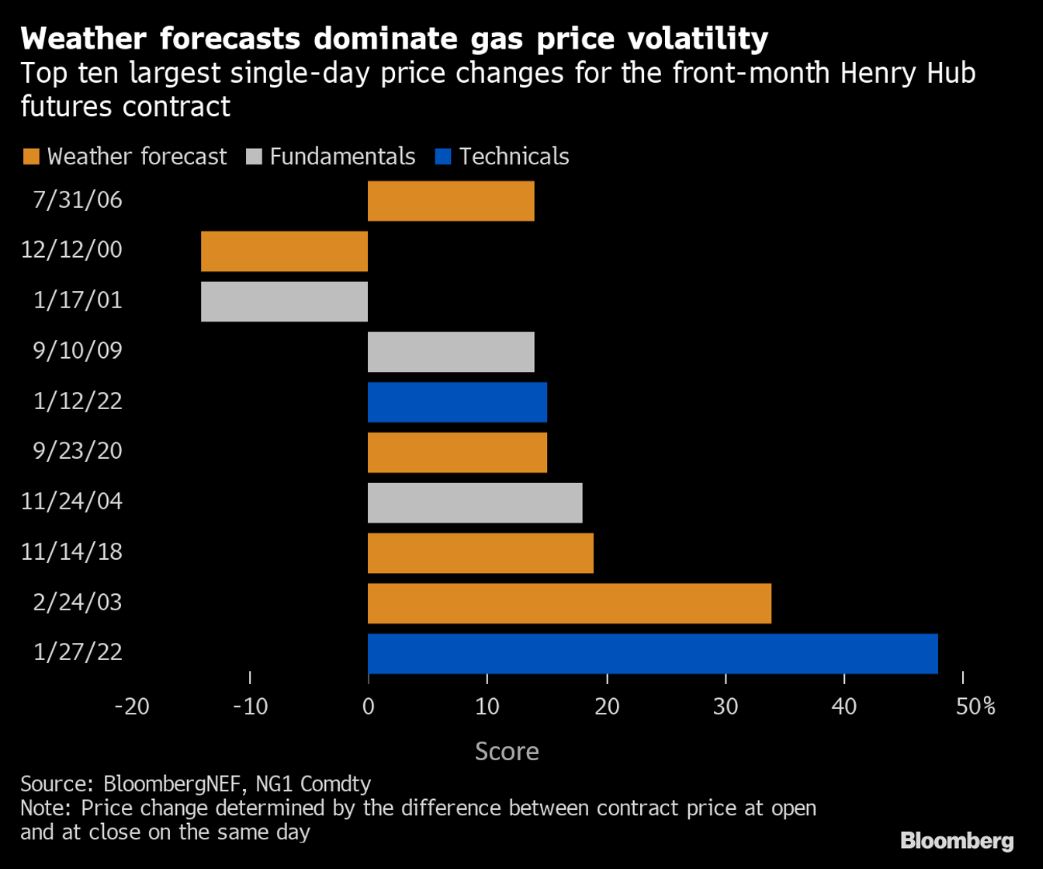
It’s clear that updates to weather forecasts are the most frequent source of major single-day price volatility. They drove five of the 10 largest increases. Technical events, like the squeeze that drove the price run-up on January 27, 2022, are relatively infrequent.
Despite this, the rally at the end of January was the largest on record by some margin. The next closest event came in February 2003, when frigid temperatures were accentuated by low storage levels and led to a huge buying spree, increasing the gas price by $2.34/MMBtu in one day. The month faced 102 heating degree-days (HDD) higher than average. Other notable events include an 18% price jump in November 2004 as the EIA storage report withdrawal was double expectations, and September 2009 when signs of economic recovery from the financial crises spurred a 14% increase.
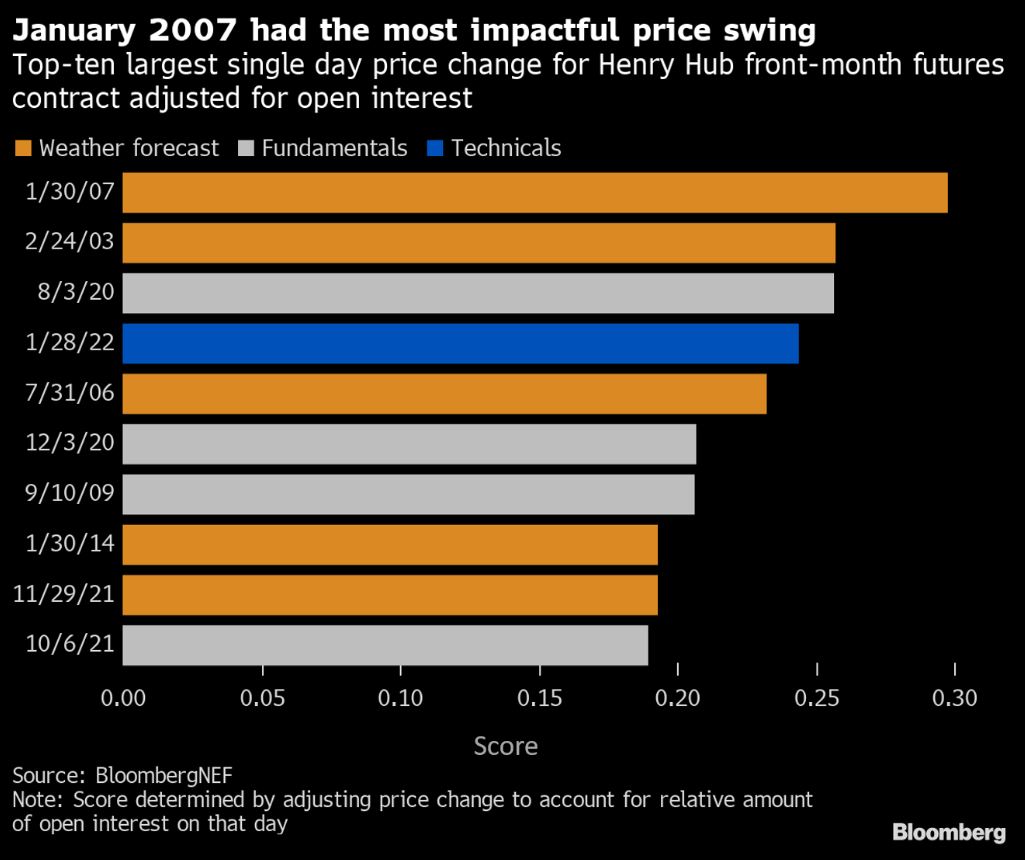
Another factor to consider is liquidity, or open interest. Large price swings are more common near contract expiry and can occur when there are only a few players left with open positions. We created a ‘score’ metric that accounts for the relative open interest available at the time of these large price swings. It quantifies the total impact of the price swing by accounting for the amount of market participation.
Under this paradigm, the largest uptick is no longer the event on Jan. 27, 2022 but rather Jan. 30, 2007. February 2007 was the second coldest February on record and faced 138HDD more than normal. As weather forecasts started to account for the coming cold, gas prices jumped 10%. This, combined with the large open interest on that day, resulted in the highest score, or the greatest impact, for our analysis.
Weather forecasts remain the dominant variable even when looking at scored results. With increasing gas price volatility expected over the next few months, all eyes will follow the latest outputs from the weather models. Degree-day forward tickers {CEHGM F22 Index} and {WHUT} can be used to track these trends from a gas perspective.